Skip to content
NAHB Logo

Eye On Housing

National Association of Home Builders Discusses Economics and Housing Policy

  • Housing Economics Plus
    • Housing Economics Plus Newsletter
    • Become a Plus Member
  • Survey Research
    • Indices
      • HMI
      • HBGI
      • CHI
      • MMS
      • AD&C
      • RMI
    • Books
  • Housing Policy Research
    • Special Studies
    • Housing's Economic Impact
  • Highlights
  • Team
  • Home
  • 2019
  • Page 2

Archives

Categories

  • Builder Finance (37)
  • Construction Statistics (251)
  • Employment/Labor (111)
  • HMI (38)
  • Home Sales and Prices (111)
  • Household Finance (95)
  • Housing Affordability (53)
  • Macroeconomics (136)
  • Multifamily (60)
  • Other Housing Data (77)
  • Policy Research (129)
  • Remodeling (21)
  • Single-Family (114)
  • Top Posts (15)

2019

  • Other Housing Data

Housing and the Agriculture Industry in the Midwest

Danushka Nanayakkara-SkillingtonJune 4, 2019June 4, 2019

Housing markets in the Midwest have experienced weakness in recent quarters. For example, single-family permits posted a 3.6% decline in year-to-date data when comparing December 2018 level with December 2017 in the Midwest. Single-family permitting for the first four months of 2019 are down 11.3%…
Read More
  • Policy Research

How Tariffs and Tariff Announcements are Affecting Building Materials Imports from China

David LoganApril 29, 2019August 20, 2024

In July 2018, the United States Trade Representative (USTR) announced its intention to levy tariffs on a series of imports from China. USTR rolled out proposed tariffs in three waves, with the third list (List 3) covering approximately $200 billion worth of Chinese imports. The…

Read More
  • Single-Family

Bedrooms, Kitchens Consume Copious Space in New Homes

Paul EmrathApril 11, 2019August 20, 2024

In the average new home, 28.0 percent of the finished floor space is allocated to bedrooms and 11.2 percent to the kitchen area, according to a recent NAHB study.  The questions covered 13 specific types of areas or rooms, plus a catch-all “other” category for…

Read More
  • Policy Research

Property Taxes by State – 2017

David LoganFebruary 25, 2019August 20, 2024

Property taxes vary widely across states both in terms of annual taxes paid as well as effective tax rates. In 2017, the difference between average real estate taxes paid by New Jersey and Alabama home owners was nearly $8,000. New Jersey continued its perennial distinction…

Read More
  • Other Housing Data

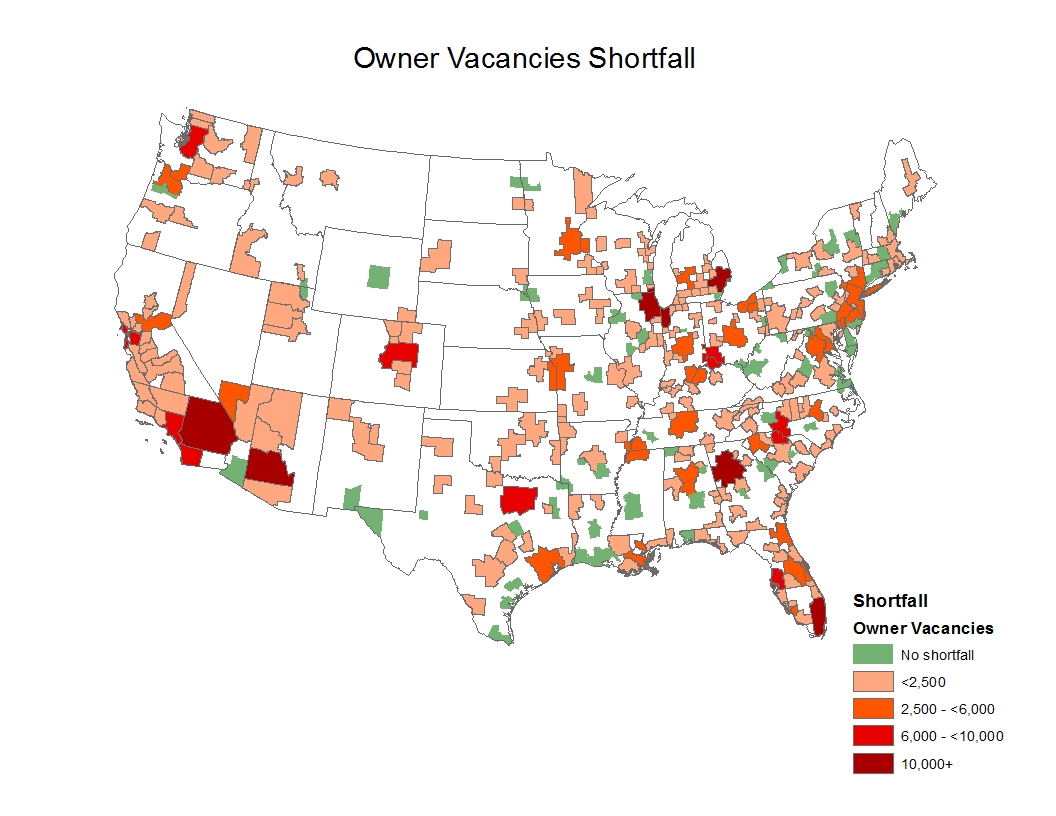
What Do Vacancy Rates Tell Us about the Shortage of Housing?

Natalia SiniavskaiaFebruary 15, 2019August 20, 2024

Vacancy rates are one of the key statistics NAHB Economics tracks to judge the health and direction of the housing market. The currently low homeowner and rental vacancy rates are typically interpreted as a sign of tight housing markets, with lower vacancy rates signaling a…

Read More
  • 1
  • 2

Subscribe to Blog via Email

Categories

Archives

Eye on the Economy Newsletter

Get bi-weekly insights from NAHB's chief economist on recent housing and economic activity.

Subscribe

Upcoming NAHB Economic Presentations

Map

  • November 20 - Indiana Builders Association
  • November 26 - Home Builders Association of Greater Cincinnati
  • December 3 - The Farnsworth Group
  • December 3 - Home Builders Association of Raleigh - Wake County
  • December 5 - Home Builders and Remodelers Association of Central Connecticut

To schedule a presentation for your group, please contact: econ@nahb.org

Wells Fargo Ad

NAHB Economics

1201 15th St NW, Washington, DC 20005
econ@nahb.org
  • NAHB
  • Housing Economics
  • NAHBNow Blog
  • The International Builders’ Show