Skip to content
NAHB Logo

Eye On Housing

National Association of Home Builders Discusses Economics and Housing Policy

  • Housing Economics Plus
    • Housing Economics Plus Newsletter
    • Become a Plus Member
  • Survey Research
    • Indices
      • HMI
      • HBGI
      • CHI
      • MMS
      • AD&C
      • RMI
    • Books
  • Housing Policy Research
    • Special Studies
    • Housing's Economic Impact
  • Highlights
  • Team
  • Home
  • single-family
  • Page 2

Archives

Categories

  • Builder Finance (37)
  • Construction Statistics (251)
  • Employment/Labor (111)
  • HMI (38)
  • Home Sales and Prices (111)
  • Household Finance (95)
  • Housing Affordability (53)
  • Macroeconomics (136)
  • Multifamily (60)
  • Other Housing Data (77)
  • Policy Research (129)
  • Remodeling (21)
  • Single-Family (114)
  • Top Posts (15)

single-family

  • Construction Statistics

Second Home Areas Gaining Home Building Market Share 

Jesse WadeSeptember 9, 2024September 9, 2024

NAHB’s featured topic for the second quarter HBGI reveals that 17.5% of single-family and 8.6% of multifamily construction takes place in second home areas. Recent NAHB analysis found that the total count of second homes across the US was 6.5 million, which accounts for 4.6%…

Read More
  • Construction Statistics

HBGI Q2 2024: Single Family Growth vs. Multifamily Decline

Jesse WadeSeptember 3, 2024September 3, 2024

Despite high mortgage rates, the lack of resale homes and pent-up demand drove solid growth in single-family permits across nearly all regions in the second quarter. In contrast, multifamily construction permit activity experienced declines across all regions for the second quarter of 2024. These trends…

Read More
  • Construction Statistics

Single-Family Build Time Continues to Trend Upward for 2023

Na ZhaoAugust 28, 2024August 28, 2024

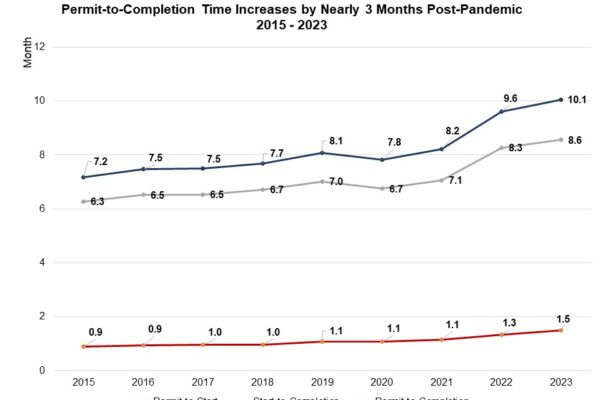
The average completion time of a single-family house in 2023 was approximately 10.1 months, breaking down to 1.5 months for authorization to start construction and another 8.6 months to finish construction. According to the Census Bureau’s Survey of Construction, the permit-to-completion time has been on…

Read More
  • Construction Statistics
  • Single-Family

Solid Levels of Single-Family Built-for-Rent Construction

Robert DietzAugust 20, 2024August 16, 2024

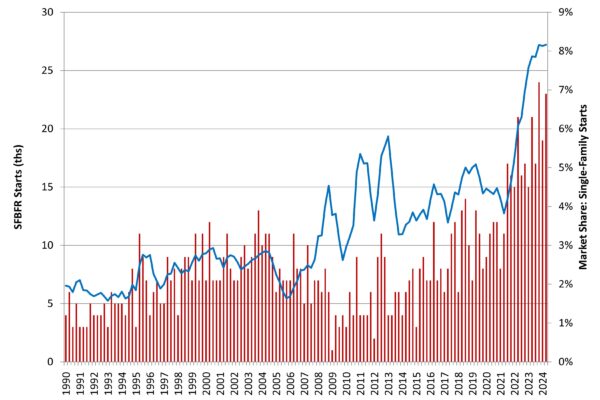
Single-family built-for-rent construction posted year-over-year gains as of the second quarter of 2024, as builders sought to add additional rental housing in a market facing ongoing, elevated mortgage interest rates. According to NAHB’s analysis of data from the Census Bureau’s Quarterly Starts and Completions by Purpose…

Read More
  • Construction Statistics
  • Single-Family

Best Quarter for Custom Home Building in Almost Two Years

Robert DietzAugust 19, 2024August 16, 2024

NAHB’s analysis of Census Data from the Quarterly Starts and Completions by Purpose and Design survey indicates gains for custom home building after some recent slowing. Custom home building typically involves home buyers less sensitive to changes for interest rates. There were 52,000 total custom building starts…

Read More
  • Construction Statistics
  • Single-Family

Townhouse Construction Gains Continue

Robert DietzAugust 16, 2024August 16, 2024

Year-over-year gains for townhouse construction continued during the second quarter 2024 as demand for medium-density housing continues to be solid despite slowing for other sectors of the building industry. According to NAHB analysis of the most recent Census data of Starts and Completions by Purpose and…

Read More
  • Multifamily
  • Single-Family

Single-Family Starts Weak in July

Robert DietzAugust 16, 2024August 16, 2024

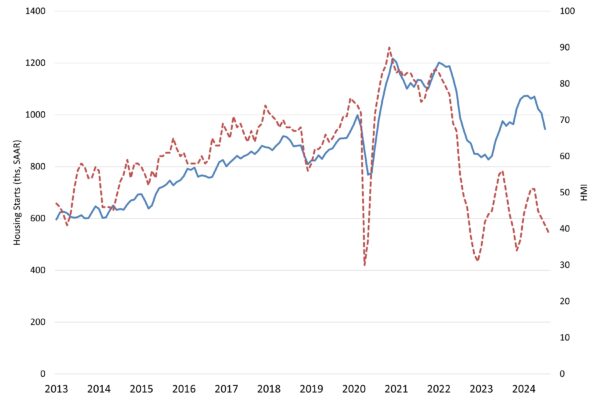
High interest rates for construction and development loans as well as ongoing challenges regarding labor shortages and higher prices for many building materials continued to slow the building market this summer. Overall housing starts decreased 6.8% in July to a seasonally adjusted annual rate of…

Read More
  • 1
  • 2
  • 3
  • 4
  • …
  • 27

Subscribe to Blog via Email

Categories

Archives

Eye on the Economy Newsletter

Get bi-weekly insights from NAHB's chief economist on recent housing and economic activity.

Subscribe

Upcoming NAHB Economic Presentations

Map

  • November 20 - Indiana Builders Association
  • November 26 - Home Builders Association of Greater Cincinnati
  • December 3 - The Farnsworth Group
  • December 3 - Home Builders Association of Raleigh - Wake County
  • December 5 - Home Builders and Remodelers Association of Central Connecticut

To schedule a presentation for your group, please contact: econ@nahb.org

Wells Fargo Ad

NAHB Economics

1201 15th St NW, Washington, DC 20005
econ@nahb.org
  • NAHB
  • Housing Economics
  • NAHBNow Blog
  • The International Builders’ Show