Skip to content
NAHB Logo

Eye On Housing

National Association of Home Builders Discusses Economics and Housing Policy

  • Housing Economics Plus
    • Housing Economics Plus Newsletter
    • Become a Plus Member
  • Survey Research
    • Indices
      • HMI
      • HBGI
      • CHI
      • MMS
      • AD&C
      • RMI
    • Books
  • Housing Policy Research
    • Special Studies
    • Housing's Economic Impact
  • Highlights
  • Team
  • Home
  • single-family
  • Page 3

Archives

Categories

  • Builder Finance (37)
  • Construction Statistics (251)
  • Employment/Labor (111)
  • HMI (38)
  • Home Sales and Prices (111)
  • Household Finance (95)
  • Housing Affordability (53)
  • Macroeconomics (136)
  • Multifamily (60)
  • Other Housing Data (77)
  • Policy Research (129)
  • Remodeling (21)
  • Single-Family (114)
  • Top Posts (15)

single-family

  • Construction Statistics

Single-Family Permit Increase Moderates in June 2024  

Danushka Nanayakkara-SkillingtonAugust 14, 2024August 8, 2024

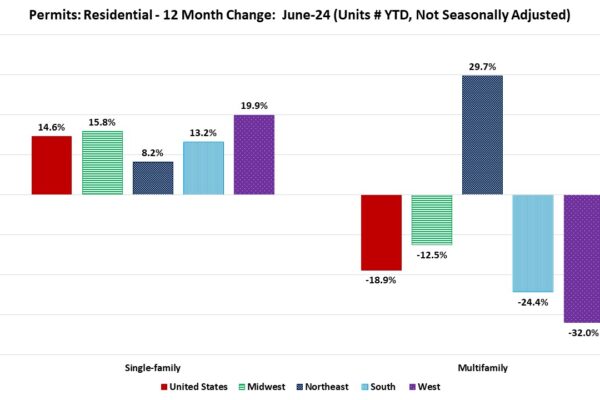
Over the first half of 2024, the total number of single-family permits issued year-to-date (YTD) nationwide reached 514,728. On a year-over-year (YoY) basis, this is an increase of 14.6% over the June 2023 level of 449,226. Year-to-date ending in June, single-family permits were up in…

Read More
  • Construction Statistics
  • Single-Family

Market Share of 5,000+ Square Foot Homes Declines in 2023

Ashok ChaluvadiJuly 26, 2024July 26, 2024

The number of homes started in 2023 exceeding 5,000 square feet, dropped to 26,000, a decrease from 29,000 in 2022, according to the annual data from the Census Bureau’s Survey of Construction (SOC). In 2006, the number of new 5,000+ square foot homes reached a peak of…

Read More
  • Construction Statistics

Lot Values Trend Higher

Natalia SiniavskaiaJuly 10, 2024July 10, 2024

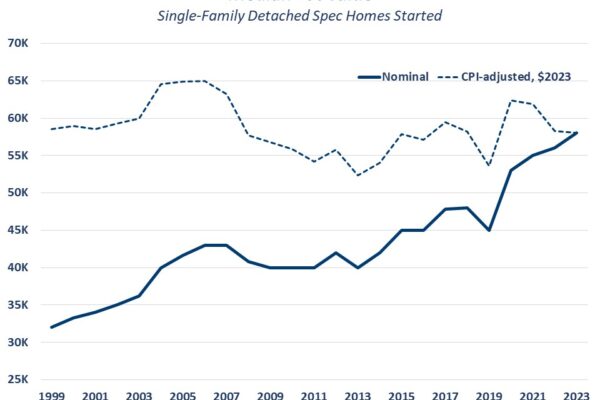
Lot values for single-family detached spec homes continued to rise, with national values reaching a new high in 2023, according to NAHB’s analysis of the Census Bureau’s Survey of Construction (SOC) data. The U.S. median lot value for single family detached for-sale homes started in…

Read More
  • Construction Statistics
  • Single-Family

Share of Smaller Lots Is at New High

Natalia SiniavskaiaJuly 9, 2024July 9, 2024

Close to two thirds (65%) of new single-family detached homes sold in 2023 were built on lots under 9,000 square feet, which is less than 1/5 of an acre. According to the latest Survey of Construction (SOC), this is the highest share on record and…

Read More
  • Construction Statistics
  • Single-Family

2023 New Single-Family Starts by Census Division

Jing FuJune 27, 2024June 26, 2024

New single-family starts have trended higher since 2012, reaching a post-pandemic peak of 1,133,145 units in 2021. During 2022 and 2023, elevated housing prices and persistently high mortgage rates have dampened housing market activity. According to NAHB analysis of the 2023 Survey of Construction (SOC),…

Read More
  • Construction Statistics

Single-Family Permits Holding Steady in April 2024  

Danushka Nanayakkara-SkillingtonJune 18, 2024June 18, 2024

Over the first four months of 2024, the total number of single-family permits issued year-to-date (YTD) nationwide reached 336,124. On a year-over-year (YoY) basis, this is an increase of 25.3% over the April 2023 level of 268,205. Year-to-date ending in April, single-family permits were up…

Read More
  • Construction Statistics

Single-Family and Multifamily Production Headed in Opposite Directions Across Geographies

Jesse WadeJune 4, 2024June 4, 2024

Fueled by a lack of existing inventory and pent-up demand, single-family permit growth is occurring across all tracked geographic regions of the nation. The opposite holds true for the multifamily sector, according to the latest findings from the National Association of Home Builders (NAHB) Home…

Read More
  • 1
  • 2
  • 3
  • 4
  • 5
  • …
  • 27

Subscribe to Blog via Email

Categories

Archives

Eye on the Economy Newsletter

Get bi-weekly insights from NAHB's chief economist on recent housing and economic activity.

Subscribe

Upcoming NAHB Economic Presentations

Map

  • November 20 - Indiana Builders Association
  • November 26 - Home Builders Association of Greater Cincinnati
  • December 3 - The Farnsworth Group
  • December 3 - Home Builders Association of Raleigh - Wake County
  • December 5 - Home Builders and Remodelers Association of Central Connecticut

To schedule a presentation for your group, please contact: econ@nahb.org

Wells Fargo Ad

NAHB Economics

1201 15th St NW, Washington, DC 20005
econ@nahb.org
  • NAHB
  • Housing Economics
  • NAHBNow Blog
  • The International Builders’ Show