Skip to content
NAHB Logo

Eye On Housing

National Association of Home Builders Discusses Economics and Housing Policy

  • Housing Economics Plus
    • Housing Economics Plus Newsletter
    • Become a Plus Member
  • Survey Research
    • Indices
      • HMI
      • HBGI
      • CHI
      • MMS
      • AD&C
      • RMI
    • Books
  • Housing Policy Research
    • Special Studies
    • Housing's Economic Impact
  • Highlights
  • Team
  • Home
  • Construction Statistics
  • Page 3

Archives

Categories

  • Builder Finance (37)
  • Construction Statistics (251)
  • Employment/Labor (111)
  • HMI (38)
  • Home Sales and Prices (111)
  • Household Finance (95)
  • Housing Affordability (53)
  • Macroeconomics (136)
  • Multifamily (60)
  • Other Housing Data (77)
  • Policy Research (129)
  • Remodeling (21)
  • Single-Family (114)
  • Top Posts (15)

Construction Statistics

Construction Statistics consists of blogs about starts and permits, construction spending, the Home Building Geography Index (HBGI) and more.

  • Construction Statistics
  • Single-Family

Bedrooms in New Single-Family Homes in 2023

Jesse WadeSeptember 23, 2024September 23, 2024

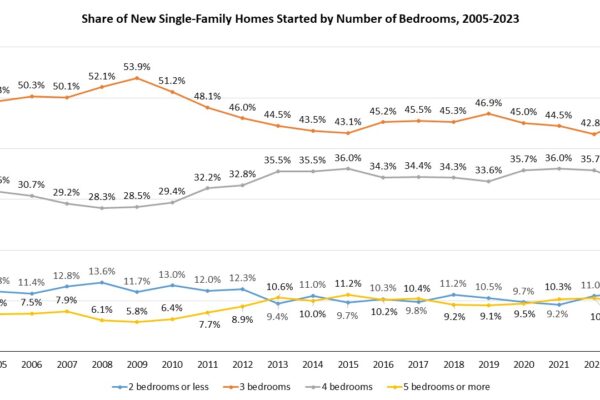
In 2023, the most common number of bedrooms in newly-built single-family homes continued to be three at a 45.7% share.  This share is up almost three percentage points from 42.8% in 2022. The second highest share was single-family homes with four bedrooms at 33.1%, followed…

Read More
  • Construction Statistics

Custom Home Building Share Declines in 2023

Ashok ChaluvadiSeptember 20, 2024September 17, 2024

In 2023, 18.8 percent of all new single-family homes started were custom homes. This share decreased from the 20.4 percent recorded in 2022, according to data tabulated from the Census Bureau’s Survey of Construction (SOC). The custom home market consists of contractor-built and owner-built homes—homes…

Read More
  • Construction Statistics
  • Multifamily
  • Single-Family

Single-Family Starts Up in August but Supply-Side Issues Linger

Danushka Nanayakkara-SkillingtonSeptember 18, 2024September 18, 2024

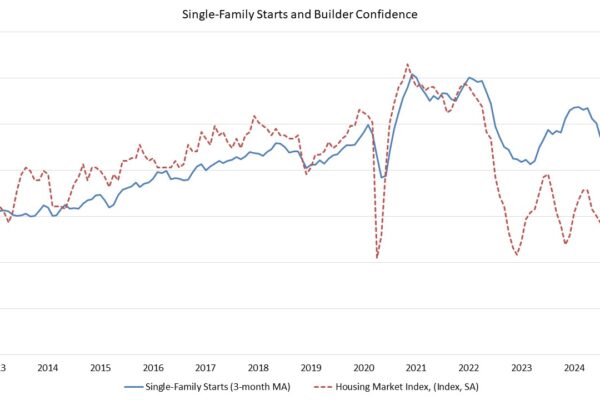
Single-family starts posted a solid gain in August on robust demand and moderating mortgage rates even as builders continue to grapple with challenges related to lot and labor shortages and elevated prices for many building materials. Overall housing starts increased 9.6% in August to a…

Read More
  • Construction Statistics
  • Multifamily

Apartment Construction Time Averaged 20 Months in 2023

Na ZhaoSeptember 16, 2024September 16, 2024

The average length of time to complete construction of a multifamily building after obtaining authorization was 19.9 months in 2023, according to the 2023 Survey of Construction (SOC) from the Census Bureau. The permit-to-completion time inched up 0.1 months in 2023, after an increase of…

Read More
  • Construction Statistics

Single-Family Permits Up in July 2024  

Danushka Nanayakkara-SkillingtonSeptember 16, 2024September 17, 2024

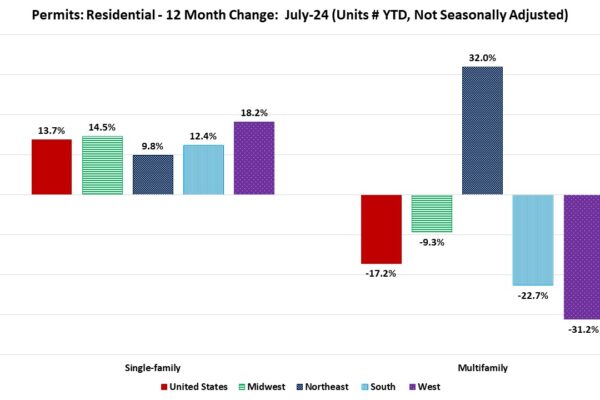
Over the first seven months of 2024, the total number of single-family permits issued year-to-date (YTD) nationwide reached 599,308. On a year-over-year (YoY) basis, this is an increase of 13.7% over the July 2023 level of 527,158. Year-to-date ending in July, single-family permits were up…

Read More
  • Construction Statistics

New Homes Built with Private Wells and Individual Septic Systems in 2023

Catherine KohSeptember 13, 2024September 11, 2024

Shares of new single-family homes built with private wells and individual septic systems decreased in 2023, compared with the previous year. NAHB tabulation of data from the Survey of Construction (SOC) indicates approximately 9% of new single-family homes started in 2023 were served by individual…

Read More
  • Construction Statistics
  • Single-Family

Market Share for Modular and Other Non-Site Built Housing in 2023

Danushka Nanayakkara-SkillingtonSeptember 12, 2024September 17, 2024

The total market share of non-site built single-family homes (modular and panelized) was just 3% of single-family homes in 2023, according to completion data from the Census Bureau Survey of Construction data and NAHB analysis. This is a slight increase from the 2% share in…

Read More
  • 1
  • 2
  • 3
  • 4
  • 5
  • …
  • 36

Subscribe to Blog via Email

Categories

Archives

Eye on the Economy Newsletter

Get bi-weekly insights from NAHB's chief economist on recent housing and economic activity.

Subscribe

Upcoming NAHB Economic Presentations

Map

  • November 20 - Indiana Builders Association
  • November 26 - Home Builders Association of Greater Cincinnati
  • December 3 - The Farnsworth Group
  • December 3 - Home Builders Association of Raleigh - Wake County
  • December 5 - Home Builders and Remodelers Association of Central Connecticut

To schedule a presentation for your group, please contact: econ@nahb.org

Wells Fargo Ad

NAHB Economics

1201 15th St NW, Washington, DC 20005
econ@nahb.org
  • NAHB
  • Housing Economics
  • NAHBNow Blog
  • The International Builders’ Show