Skip to content
NAHB Logo

Eye On Housing

National Association of Home Builders Discusses Economics and Housing Policy

  • Housing Economics Plus
    • Housing Economics Plus Newsletter
    • Become a Plus Member
  • Survey Research
    • Indices
      • HMI
      • HBGI
      • CHI
      • MMS
      • AD&C
      • RMI
    • Books
  • Housing Policy Research
    • Special Studies
    • Housing's Economic Impact
  • Highlights
  • Team
  • Home
  • 2023
  • February
  • Page 2

Archives

Categories

  • Builder Finance (37)
  • Construction Statistics (251)
  • Employment/Labor (111)
  • HMI (38)
  • Home Sales and Prices (111)
  • Household Finance (95)
  • Housing Affordability (53)
  • Macroeconomics (136)
  • Multifamily (60)
  • Other Housing Data (77)
  • Policy Research (129)
  • Remodeling (21)
  • Single-Family (114)
  • Top Posts (15)

February 2023

  • Home Sales and Prices

Existing Home Sales Continue to Fall in January

Fan-Yu KuoFebruary 21, 2023June 20, 2024

As elevated mortgage rates and tight inventory continue to weaken housing demand, the volume of existing home sales declined for a twelfth consecutive month as of January, according to the National Association of Realtors (NAR). This is the longest run of declines since 1999. While…

Read More
  • Single-Family

Additional Declines for New Home Size

Robert DietzFebruary 21, 2023February 16, 2023

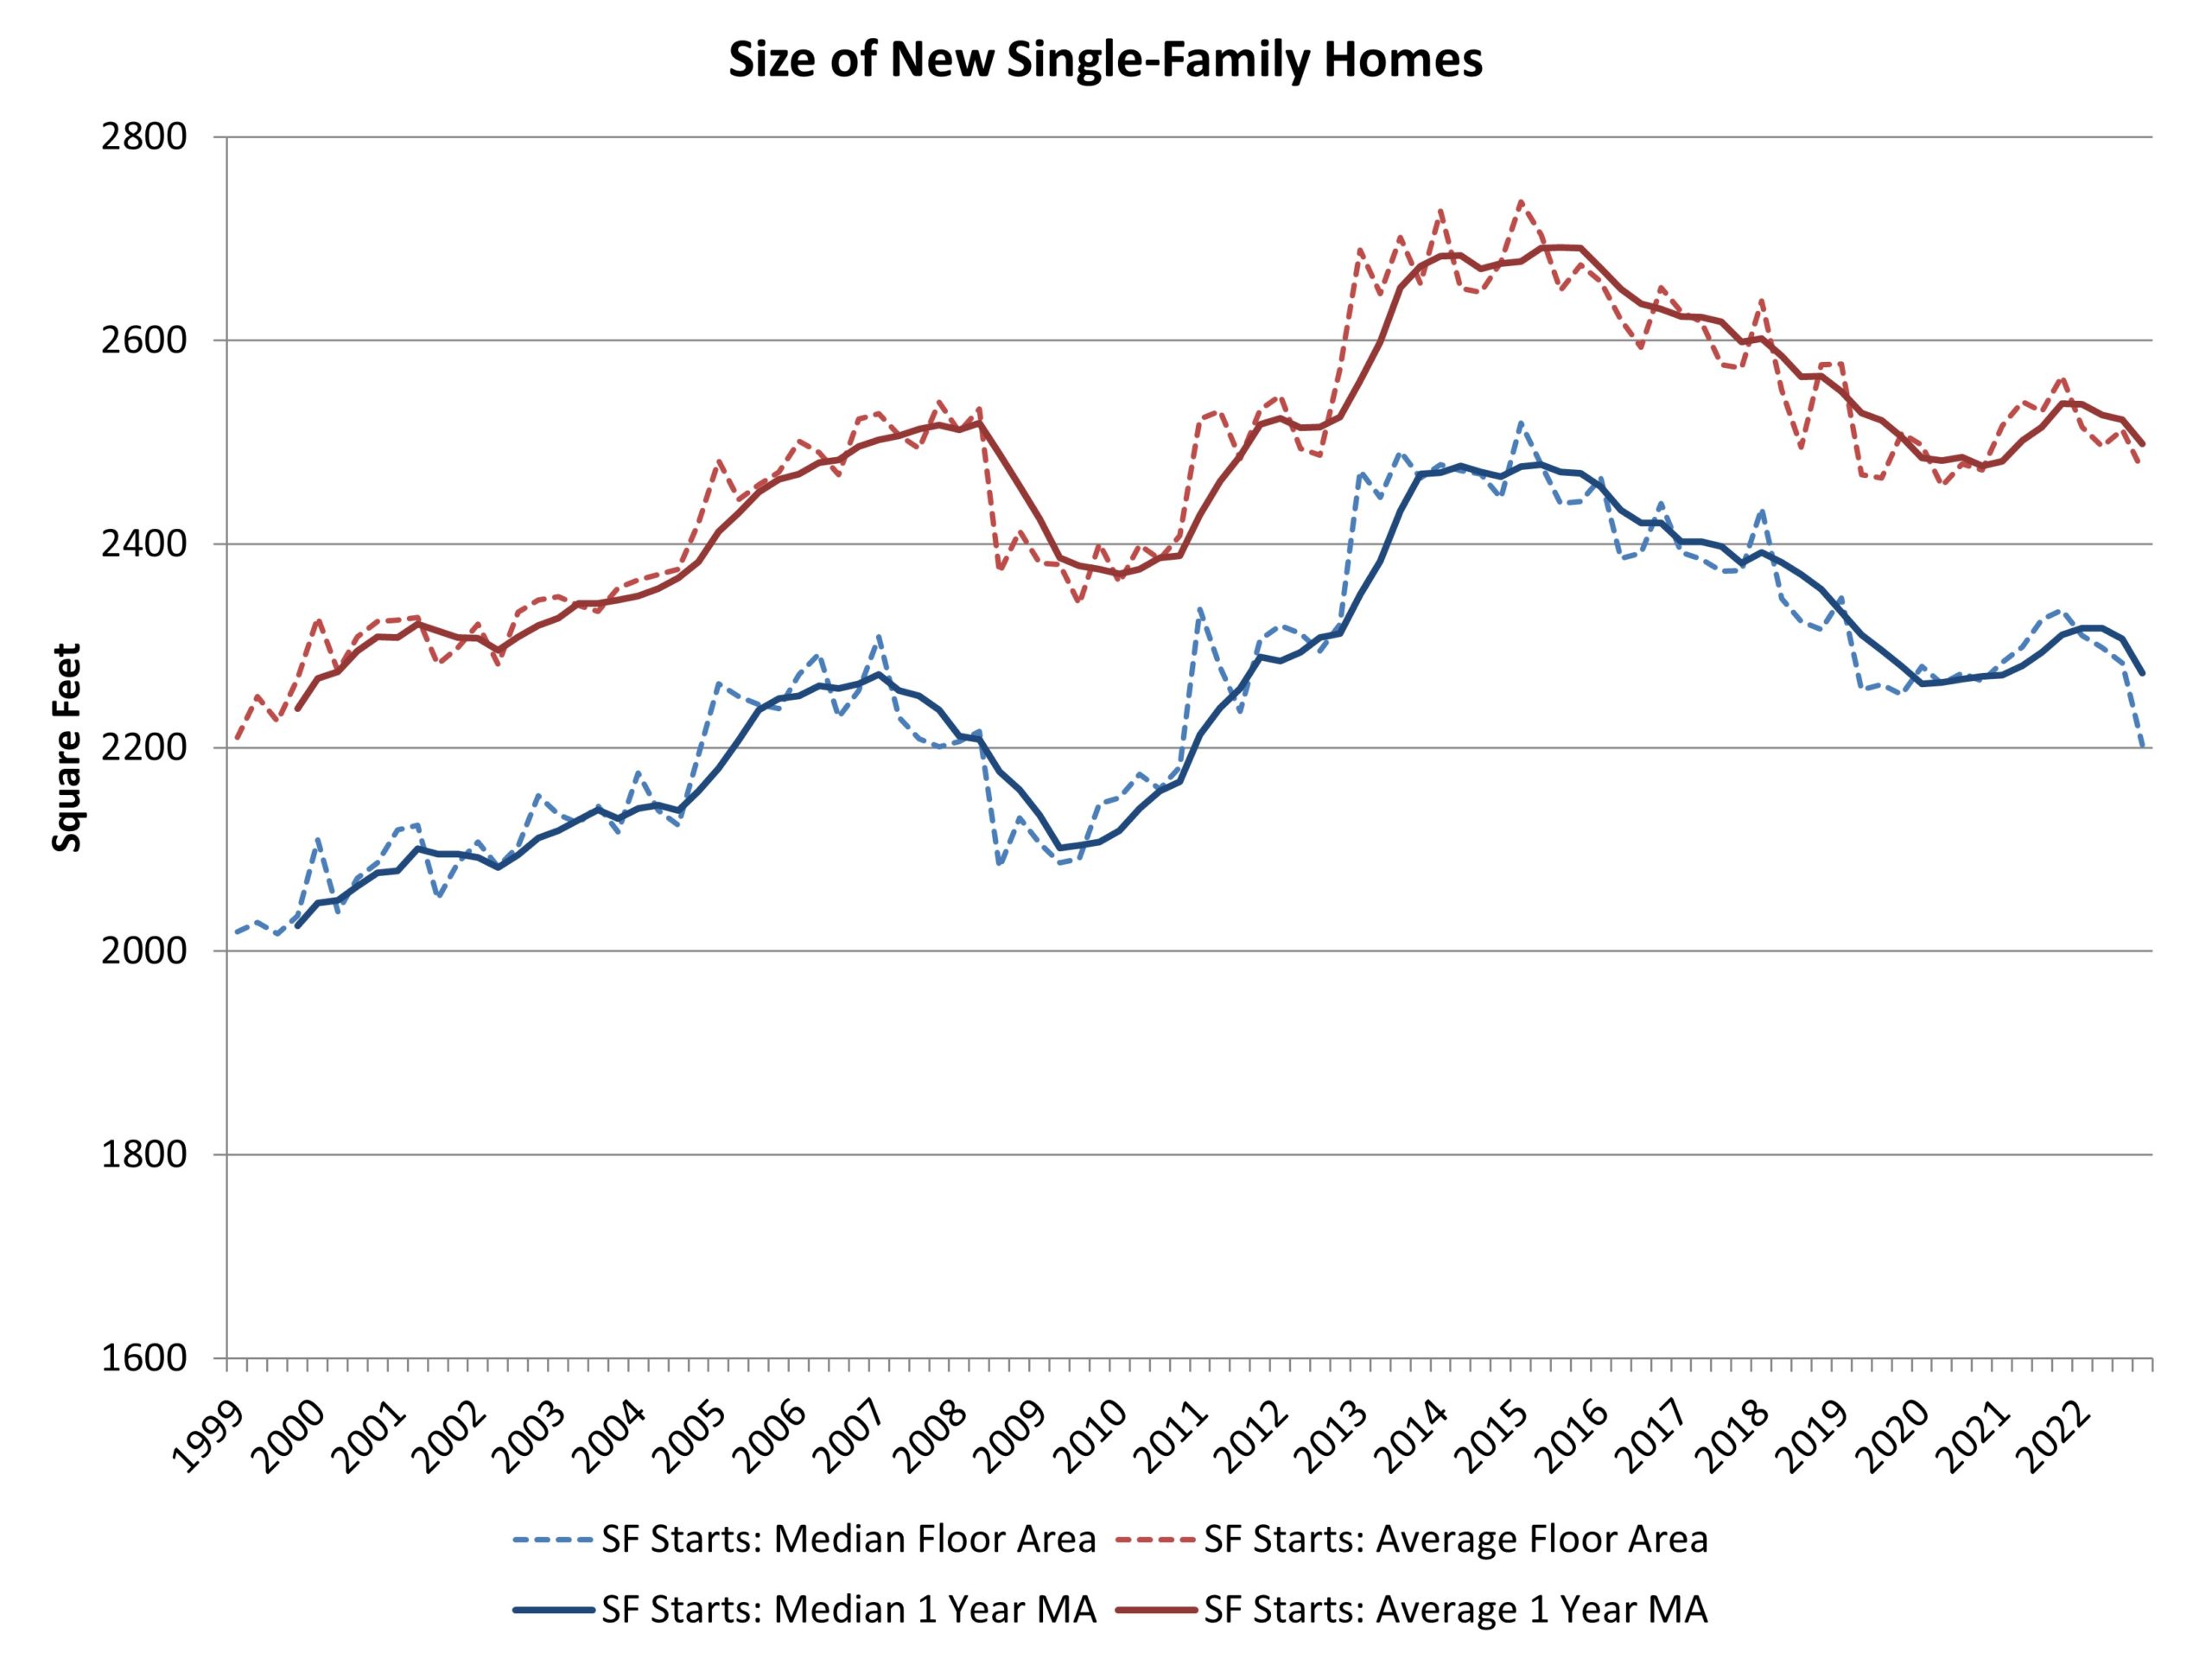
An expected impact of the pandemic was a need for more residential space, as people use homes for more purposes including work. During the housing boom after covid, this led to a rise for new single-family home size. However, as the housing market weakens on…

Read More
  • Construction Statistics

Custom Home Building Posts Small Gain in 2022

Robert DietzFebruary 20, 2023February 16, 2023

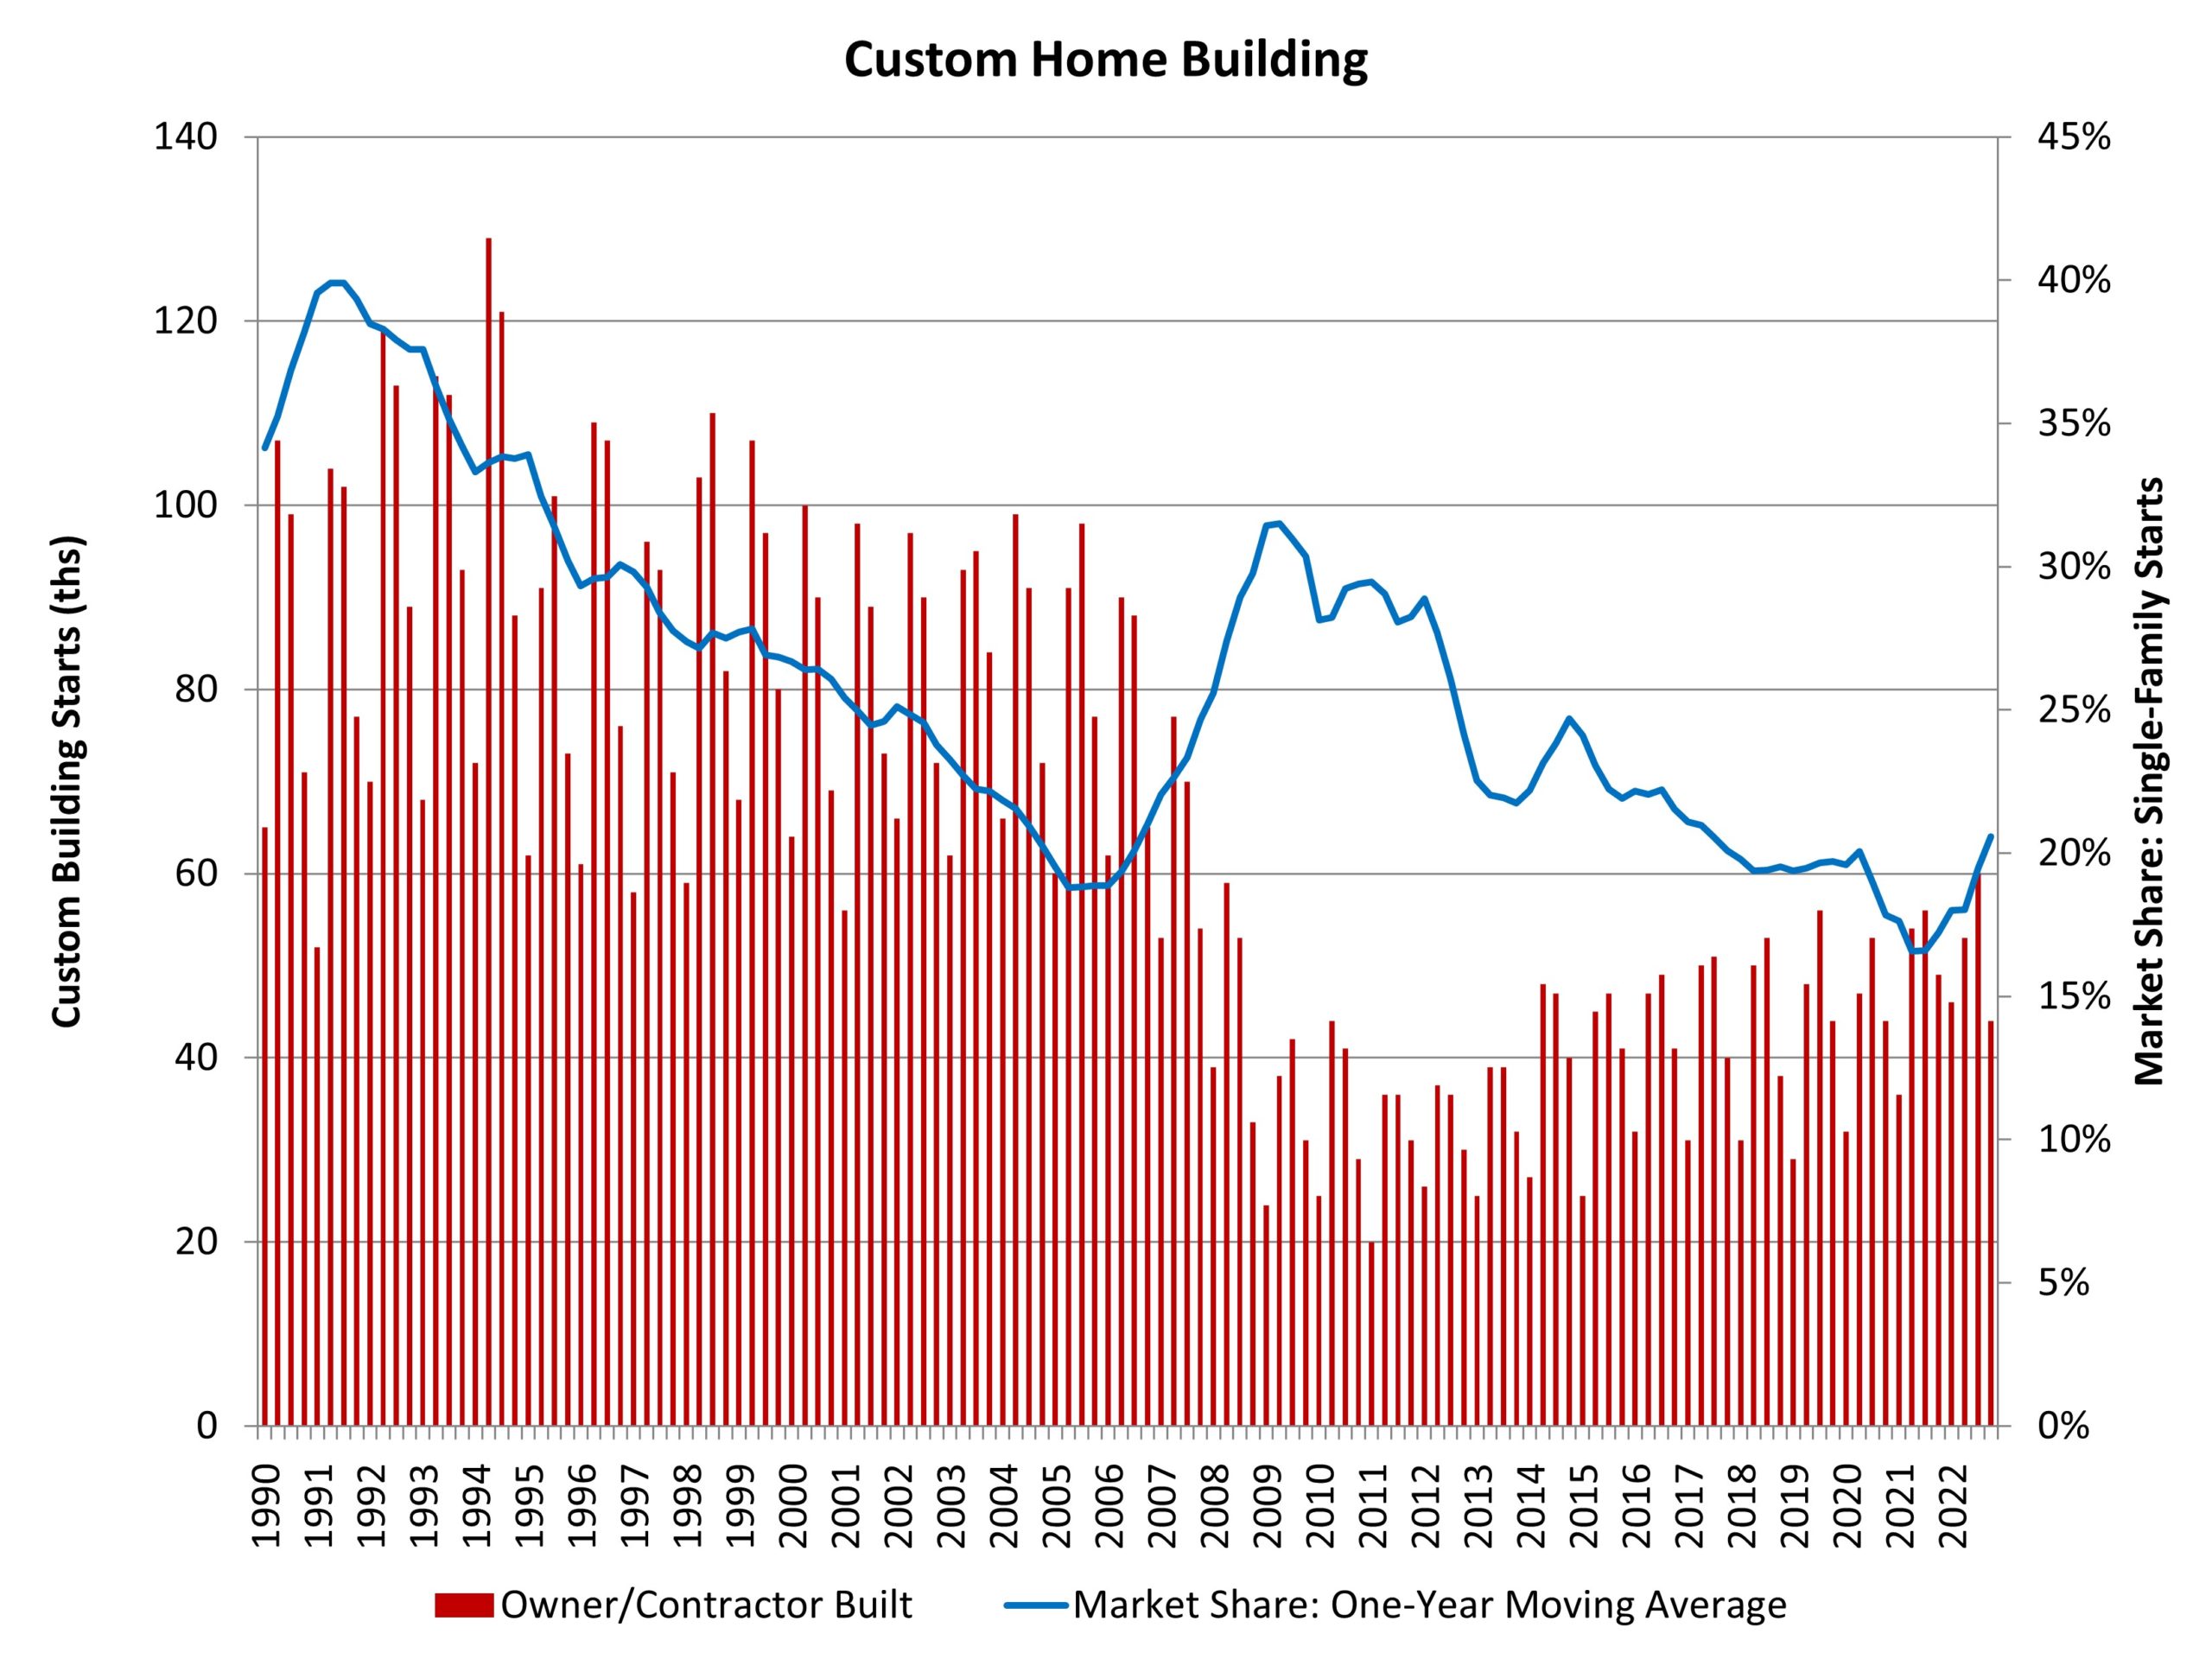
NAHB’s analysis of Census Data from the Quarterly Starts and Completions by Purpose and Design survey indicates custom home building gained market share during 2022. There were 44,000 total custom building starts during the fourth quarter of the year. This marks a 10% decline compared to the…

Read More
  • Home Sales and Prices

Market Share of All-Cash New Home Sales Hits 32-Year High

David LoganFebruary 17, 2023August 20, 2024

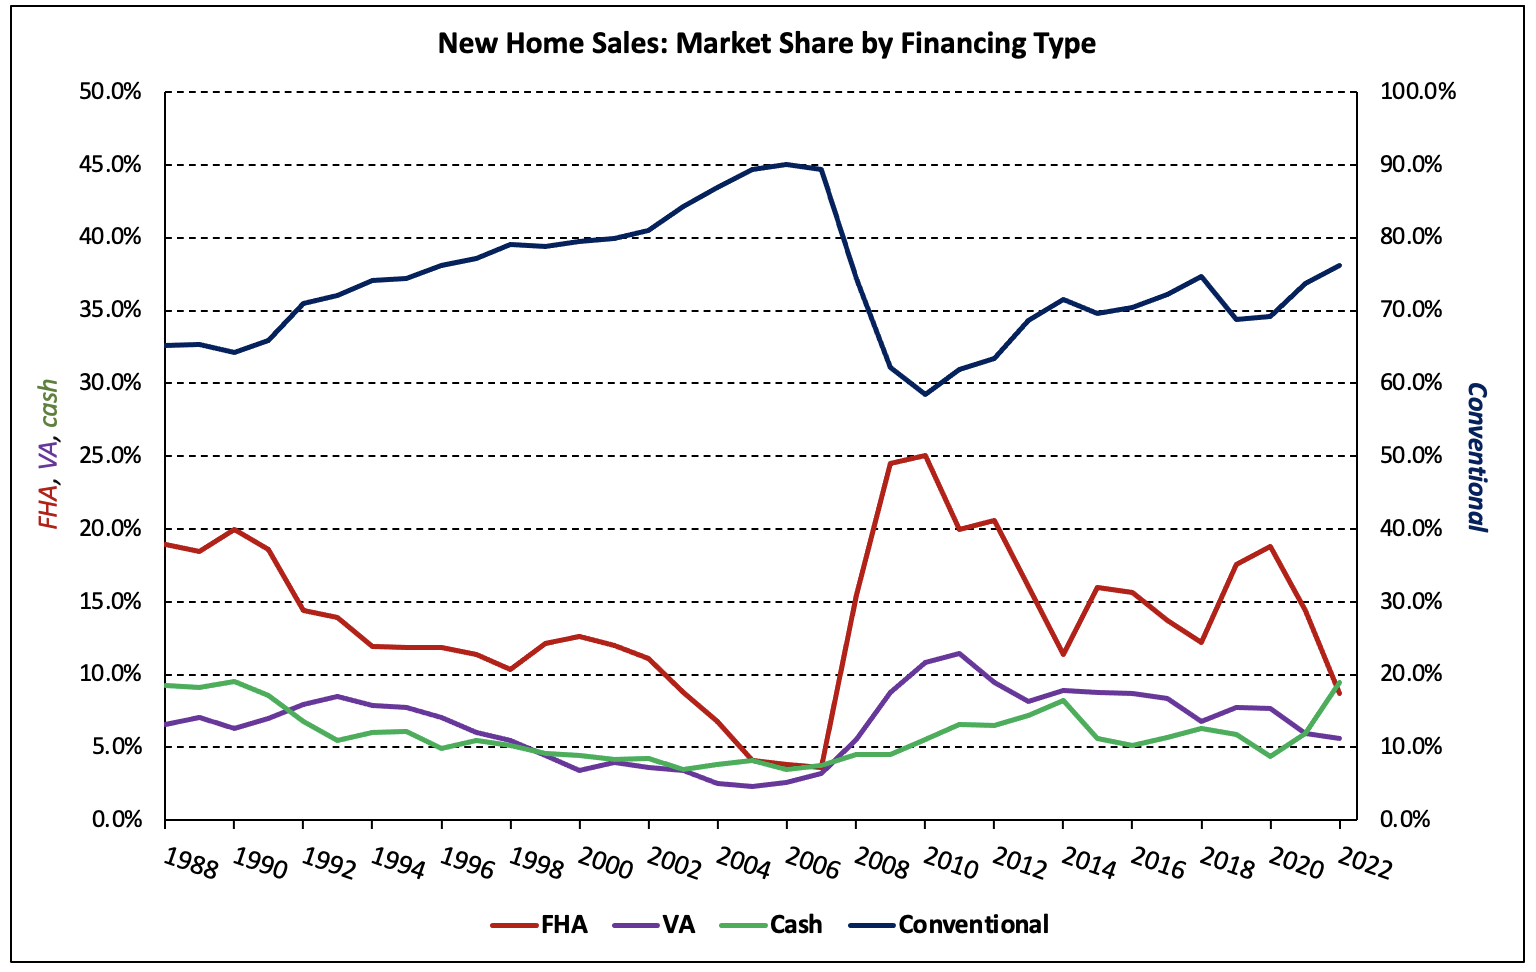
NAHB analysis of the most recent Quarterly Sales by Price and Financing published by the U.S. Census Bureau reveals that cash purchases made 11.2% of new home sales in the fourth quarter of 2022—the largest share since 1990. The share of cash purchases has climbed each…

Read More
  • Construction Statistics

Townhouse Construction Share Climbs to Near Four-Decade High

Robert DietzFebruary 17, 2023February 16, 2023

According to NAHB analysis of the most recent Census data of Starts and Completions by Purpose and Design, during the fourth quarter of 2022, single-family attached starts totaled 37,000, which is 8% lower than the fourth quarter of 2021. Over the course of 2022, townhouse construction…

Read More
  • Policy Research

Building Materials Prices Increase in January Reversing Four-Month Trend

David LoganFebruary 16, 2023February 16, 2023

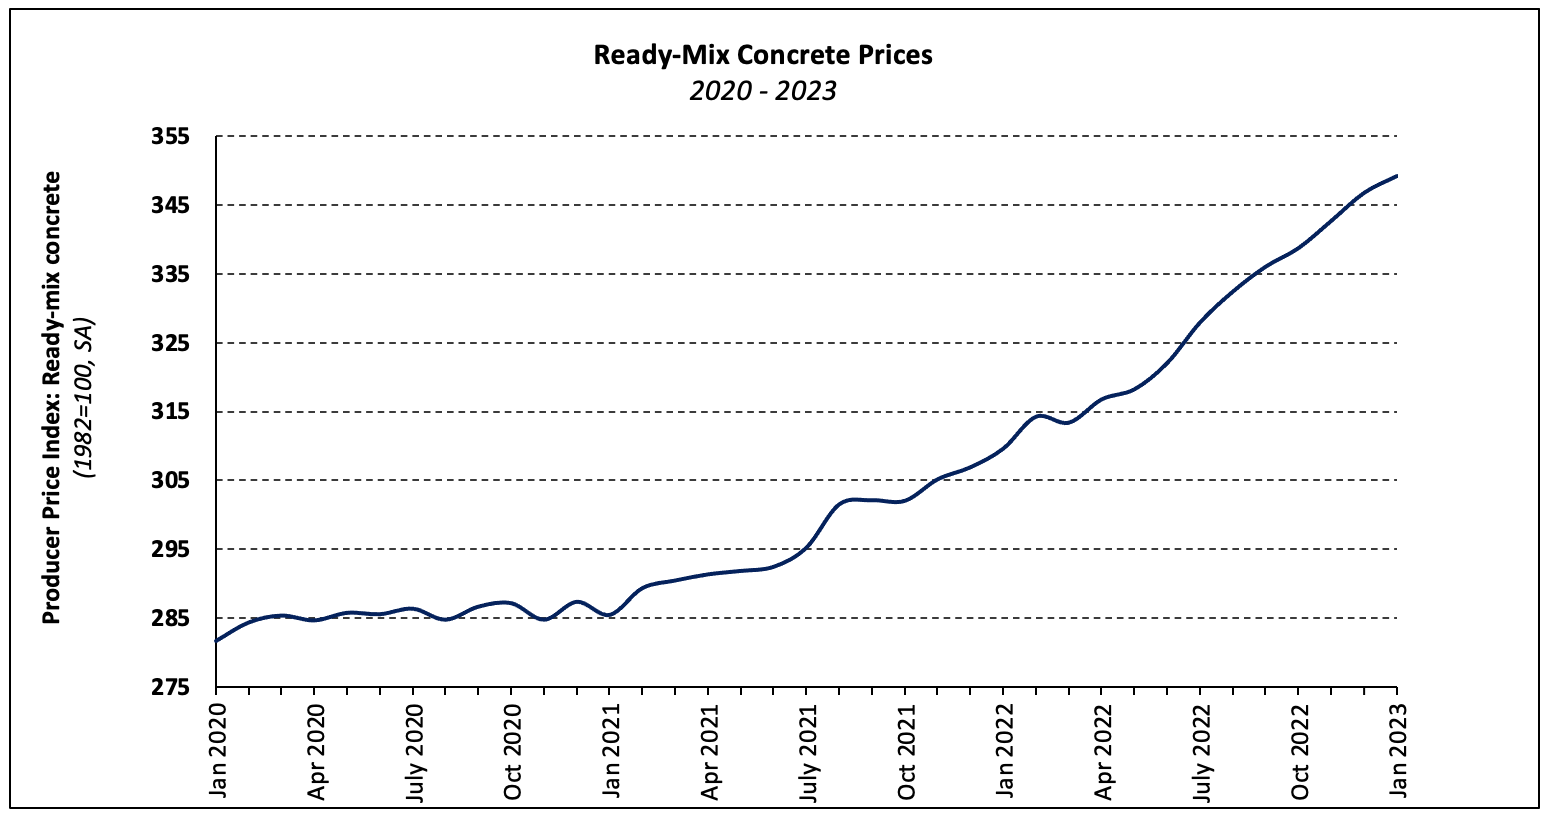
After four consecutive declines, the producer price index (PPI) for inputs to residential construction less energy (i.e. building materials) rose 0.9% in January 2023 (not seasonally adjusted) according to the latest PPI report. Price growth of goods inputs to residential construction, including energy, gained 1.4% over…

Read More
  • Single-Family

Single-Family Built-for-Rent Growth Strong in 2022

Robert DietzFebruary 16, 2023February 16, 2023

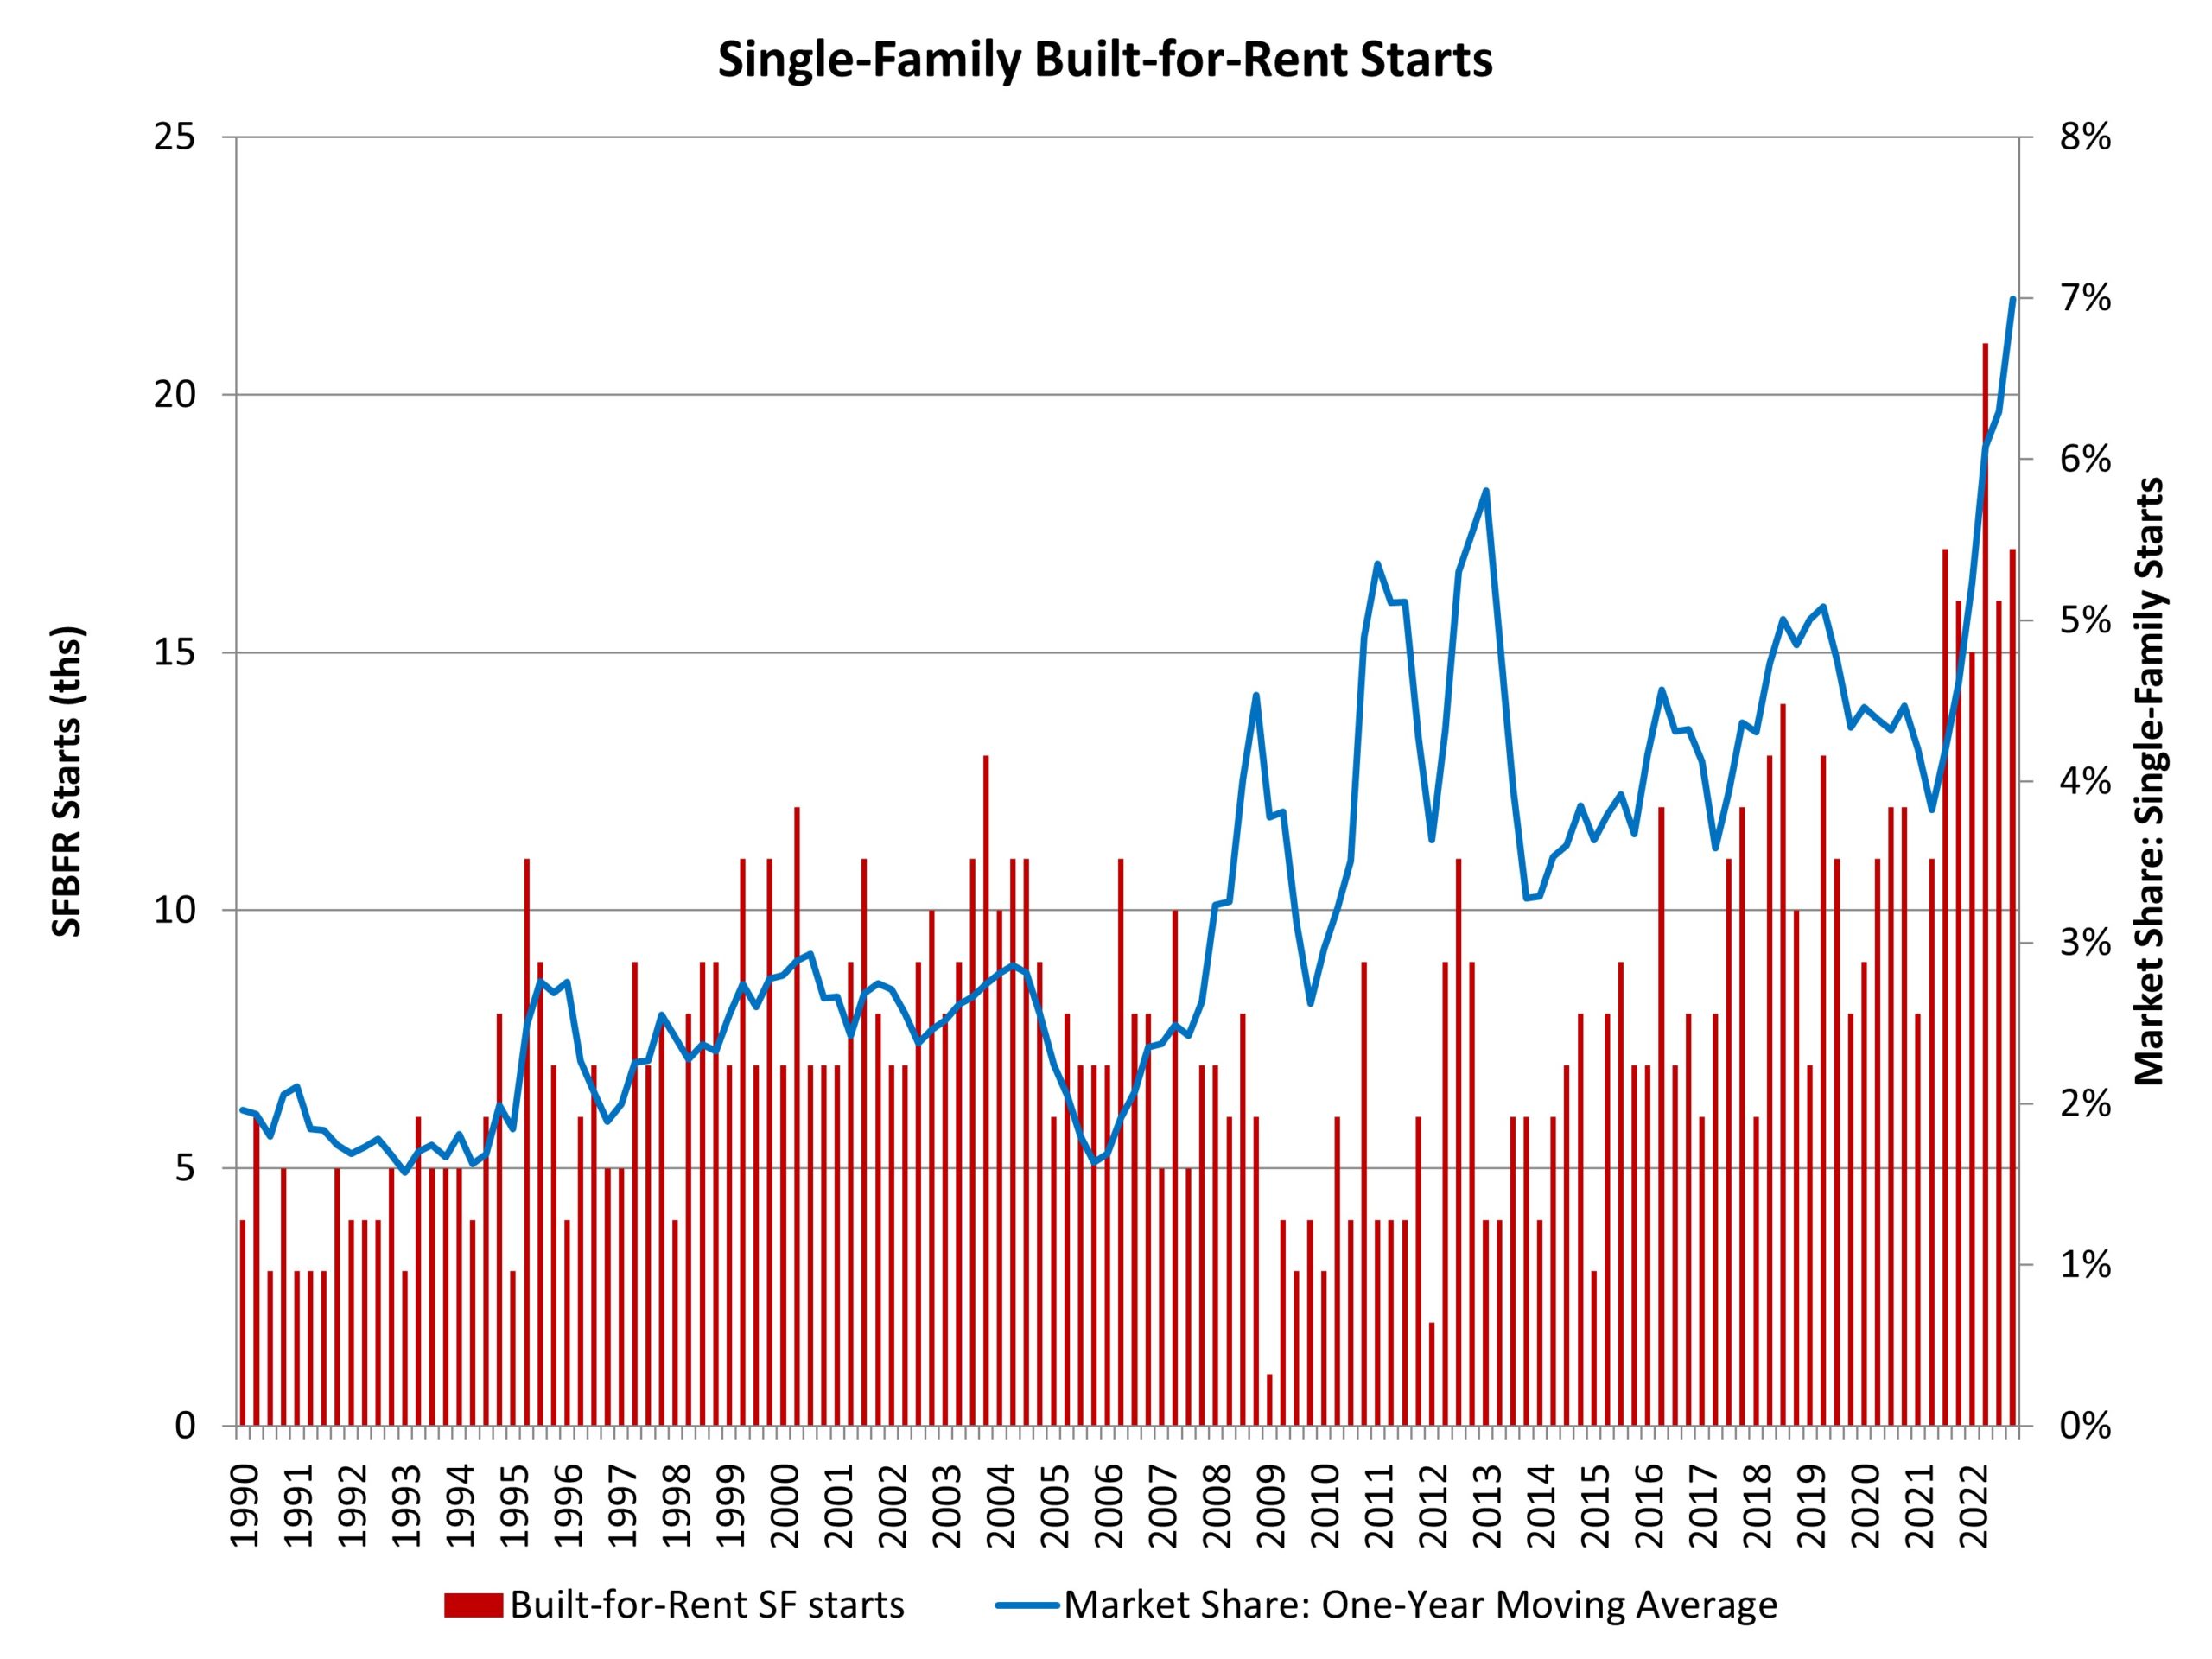
Single-family built-for-rent construction ended 2022 strong with a rising total market share. According to NAHB’s analysis of data from the Census Bureau’s Quarterly Starts and Completions by Purpose and Design, there were approximately 17,000 single-family built-for-rent (SFBFR) starts during the fourth quarter of 2022. This is…

Read More
  • 1
  • 2
  • 3
  • 4
  • 5

Subscribe to Blog via Email

Categories

Archives

Eye on the Economy Newsletter

Get bi-weekly insights from NAHB's chief economist on recent housing and economic activity.

Subscribe

Upcoming NAHB Economic Presentations

Map

  • November 20 - Indiana Builders Association
  • November 26 - Home Builders Association of Greater Cincinnati
  • December 3 - The Farnsworth Group
  • December 3 - Home Builders Association of Raleigh - Wake County
  • December 5 - Home Builders and Remodelers Association of Central Connecticut

To schedule a presentation for your group, please contact: econ@nahb.org

Wells Fargo Ad

NAHB Economics

1201 15th St NW, Washington, DC 20005
econ@nahb.org
  • NAHB
  • Housing Economics
  • NAHBNow Blog
  • The International Builders’ Show